Quick start
Luzmo Flex is an SDK that enables you to create customizable visualizations fully from code, allowing you to build and embed powerful, hyper-personalized data analytics products.
You can use the embedding libraries to start using Flex in any webpage . The following libraries are available via npm:
Follow the guide below to quickly get started with Flex.
Installation instructions
Run the command corresponding to the choice of framework you prefer.
npm install @luzmo/embedBasic usage
If you're looking for a step-by-step walkthrough to create your first Flex item, take a look at this Guide that explains how to create a Column chart with Luzmo's Flex SDK!
Import the component in a JavaScript module.
import '@luzmo/embed';You can also import the component in an HTML page.
<script type="module">
  import './node_modules/@luzmo/embed/index.js';
</script>
<!-- OR -->
<script
  type="module"
  src="./node_modules/@luzmo/embed/index.js">
</script>
Add the Luzmo VizItem component to your HTML page.
<!--
Clients on our US multi-tenant application environment,
or a dedicated instance on a specific VPC, should specify:
- appServer="https://app.us.luzmo.com/" (or your VPC-specific address)
- apiHost="https://api.us.luzmo.com/" (or your VPC-specific address)
-->
<luzmo-embed-viz-item
  appServer="< Luzmo App server, defaults to https://app.luzmo.com >"
  apiHost="< Luzmo API server, defaults to https://api.luzmo.com >"
  authKey="< Embed authorization key >"
  authToken="< Embed authorization token >"
  options="< options to override >"
  slots="< slots for chart >"
  type="bar-chart"
></luzmo-embed-viz-item>
Component properties
The only necessary properties that need to be specified in order to embed a viz item securely , are:
authKey- an Embed Authorization idauthToken- an Embed Authorization tokentype- the chart type to render (for example,bar-chart)
You will also typically provide slots (and optionally options ) to define the data and appearance of the visualization. See the column chart walkthrough for a complete example.
The Embed key-token pair should be requested from your application's backend each time a specific end-user of your application wants to see an embedded Luzmo viz item (see the step 'generate an Embed token' in the 'Dashboard embedding' guide ). After receiving the temporary token from your backend, pass it to the frontend component before the viz item loads.
Depending on the locality of the Luzmo application where your organization resides, it might be necessary to first specify the appServer and apiHost properties! Customers on e.g. our US multi-tenant application environment should specify ' https://app.us.luzmo.com ' as appServer , and ' https://api.us.luzmo.com ' as apiHost .
Replace the placeholder values for options and slots with JSON objects. The chart docs describe available chart types, slots, and options.
The component reference contains in-depth information about the available component properties, methods, and events.
The chart docs reference contains all information about the various chart types, their slots and options.
The examples section shows concrete examples of what you can build with Flex.
Using filters in Flex
Flex provides powerful filtering features. In this section we are going to tackle some simpler use cases. These simpler use cases can be combined together to form more complicated use cases.
This section assumes you are familiar with the concept of dataset and columns in Luzmo:
datasetIdcan be found by browsing to the specific dataset page and finding the ID in the URL.columnIdcan be found using the dropdown on the column field in dataset view page.
How filters work
Filters allow you to filter out values that are displayed in a viz item. Some common use cases could be wanting to show a specific set of countries, or showing data only from a specific time frame.
The gif below shows how applying a filter will affect a viz item.
If you use the web component, replace <luzmo-viz-item> with <luzmo-embed-viz-item> in the examples below.
Chart before and after applying filters
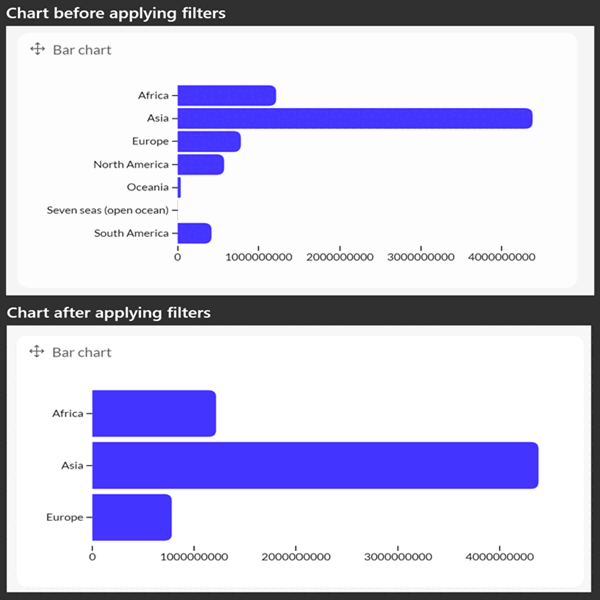
In the above gif, we only show data from a list of continents, the filter code for this example is as follows.
<luzmo-viz-item
  type="bar-chart"
  filters='[
    {
      "condition": "or",
      "filters": [
        {
          "expression": "? in ?",
          "parameters": [
            {
              "columnId": "4c1eee0b-3a5f-41e1-820f-d09440784c67",
              "datasetId": "f6b55beb-8a92-4976-81fa-1aecc7b27e49",
              "level": 1
            },
            ["Europe", "Asia", "Africa"]
          ]
        }
      ]
    }
  ]'
  slots='[
    {
      "name": "y-axis",
      "content": [
        {
          "type": "hierarchy",
          "label": "Region",
          "columnId": "4c1eee0b-3a5f-41e1-820f-d09440784c67",
          "datasetId": "f6b55beb-8a92-4976-81fa-1aecc7b27e49"
        }
      ]
    },
    {
      "name": "measure",
      "content": [
        {
          "type": "numeric",
          "format": "$,.2s",
          "label": "Total cost",
          "aggregationFunc": "sum",
          "columnId": "88916a0d-b238-4d2a-af84-63f6121088e1",
          "datasetId": "f6b55beb-8a92-4976-81fa-1aecc7b27e49"
        }
      ]
    }
  ]'
>
</luzmo-viz-item>
Let's take a close look at the filters option.
The value passed to the filters input is an array of objects.
[
  {
    "condition": "or",
    "filters": [
      {
        "expression": "? in ?",
        "parameters": [
          {
            "columnId": "4c1eee0b-3a5f-41e1-820f-d09440784c67",
            "datasetId": "f6b55beb-8a92-4976-81fa-1aecc7b27e49",
            "level": 1
          },
          ["Europe", "Asia", "Africa"]
        ]
      }
    ]
  }
]
The condition groups the filters array next to it in an OR condition; every entry in the filters array (present just below condition ) will be combined with OR.
Now let's have a look at the first object in the filters array. It has the following fields.
The ? in ? tells the application to search for values from the list of values provided.
parameters is an array containing 2 values, first contains the information on which columnId and datasetId to apply filter on and the second value in the array is an array (It can also be a single value) of values to filter on.
A more verbose documentation can be found here
Another example, In this example the parameters second value is not an array.
[
  {
    "condition": "or",
    "filters": [
      {
        "expression": "? = ?",
        "parameters": [
          {
            "columnId": "4c1eee0b-3a5f-41e1-820f-d09440784c67",
            "datasetId": "f6b55beb-8a92-4976-81fa-1aecc7b27e49",
            "level": 1
          },
          "Asia"
        ]
      }
    ]
  }
]
Examples
More examples to help you better understand how to work with filters.
I want to filter countries with population greater than 0.20
To solve this problem we are going to use the ? > ? expression. Replace columnId with the Population column id.
[
  {
    "condition": "or",
    "filters": [
      {
        "expression": "? > ?",
        "parameters": [
          {
            "columnId": "4c1eee0b-3a5f-41e1-820f-d09440784c67",
            "datasetId": "f6b55beb-8a92-4976-81fa-1aecc7b27e49",
            "level": 1
          },
          0.20
        ]
      }
    ]
  }
]
I want to filter countries whose data was last updated on 24th of June 2024
To solve this problem we are going to use the ? >= ? expression. Replace columnId with the relevant date column id.
[
  {
    "condition": "or",
    "filters": [
      {
        "expression": "? >= ?",
        "parameters": [
          {
            "columnId": "4c1eee0b-3a5f-41e1-820f-d09440784c67",
            "datasetId": "f6b55beb-8a92-4976-81fa-1aecc7b27e49",
            "level": 1
          },
          "2024-06-24T00:00:00.000Z"
        ]
      }
    ]
  }
]
I want to filter out countries whose data was updated between 22nd of June and 24th of June 2024
To solve this problem, we are going to use the ? between ? expression. Replace columnId with the relevant date column id.
The same operation can be carried out using a combination of ? > ? and ? < ? expressions.
[
  {
    "condition": "or",
    "filters": [
      {
        "expression": "? between ?",
        "parameters": [
          {
            "columnId": "4c1eee0b-3a5f-41e1-820f-d09440784c67",
            "datasetId": "f6b55beb-8a92-4976-81fa-1aecc7b27e49",
            "level": 1
          },
          ["2024-06-22T00:00:00.000Z", "2024-06-24T00:00:00.000Z"]
        ]
      }
    ]
  }
]